
 By
By
Grease analysis is a legitimate diagnostic. If you're running it on your robot reducers, you're ahead of most plants. This post is not an argument against it.
It's an argument about what happens between samples.
The interval is the problem
Grease sampling gives you a point measurement. You pull a sample, you get a particle-per-million count, and you make a decision based on where that number sits against a threshold.
Now consider what the number actually represents. Iron content in grease accumulates as a consequence of wear that has already occurred. It's a lagging indicator sampled at a lagging interval. If your sampling cycle is quarterly and a joint enters accelerated wear in week three, you will not know until week thirteen, assuming the joint survives that long.
Two failure patterns follow directly from this:
The false negative. A sample comes back low. The joint is cleared. But grease was replenished recently, or the wear debris settled, or the degradation started after the pull. The plant reads "healthy" and gets a functional failure during a production shift. This is the most expensive outcome in the entire program, because it carries the confidence of a test result.
The false positive from trending data. The opposite problem shows up in generic trending programs that flag anything outside a band. Technicians get sent to inspect healthy joints. Trust in the alerts erodes. Within a couple of quarters, people stop responding to them.
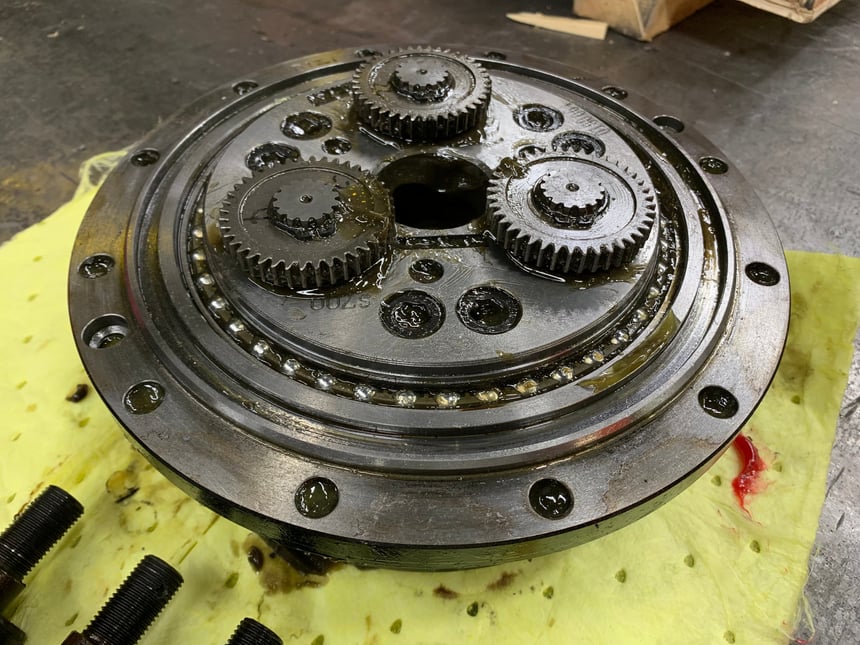
One of our automotive customers documented a J3 reducer where grease analysis, verified by the maintenance team, came back above 10,500 PPM; a joint well into failure. The value of that reading wasn't in dispute. The question was how long it had been climbing before anyone pulled the sample.
What continuous monitoring adds
Vibration doesn't wait for an interval. As a bearing race pits or a gear tooth chips, the vibration spectrum shifts immediately, rising amplitude at gear-mesh and bearing frequencies, long before the joint seizes and long before enough metal accumulates to move a PPM count.
Monitoring that spectrum continuously changes the role of grease analysis rather than replacing it. Instead of being the primary screening method applied to every robot on a calendar, sampling becomes the confirmation step applied to the specific joint that vibration data has already flagged.
That's a meaningful shift in how technician hours get spent:
|
|
Time-based sampling |
Condition-based monitoring |
|
Coverage |
Every robot, periodically |
Every robot, continuously |
|
Trigger for action |
Calendar date |
Measured deviation from baseline |
|
Technician effort |
Distributed across all assets |
Concentrated on flagged assets |
|
Warning window |
Interval-dependent |
Weeks to months before failure |
|
Failure between checks |
Undetected |
Detected as it develops |
The second benefit: grease as a treatment, not just a test
Here's the part that surprises people. When you can see the initial signs of wear rather than the accumulated evidence of it, grease stops being purely diagnostic and becomes an intervention.
A joint showing early degradation can often be brought back with increased grease replenishment frequency, extending its usable life rather than queuing it for replacement. That only works if you catch it early enough to matter, which means it only works with continuous data.
An automotive plant that adopted RSA described exactly this sequence: early alerts on initial signs of wear let them increase replenishment frequency and begin extending reducer life. They also eliminated time-based grease sampling as a standing PM, which freed technicians for work with a higher return.
"By moving to the condition-based approach of RSA™ we were able to reduce our technicians' PM workload and redirect them to more effective work by eliminating the need for time-based grease sampling."
— Kenny Casperson, Plant 2 MESD Lead, Honda — Lincoln, Alabama
Two wins from one change: fewer failures, and fewer hours spent on a PM that was mostly confirming healthy joints.
How to run both together
If you already have a grease sampling program, the practical migration path looks like this:
1. Keep sampling initially. Run it alongside vibration monitoring for one or two cycles. You want the correlation data, it's what convinces skeptical technicians.
2. Use vibration to target the samples. Pull from flagged joints first. You'll find that the flags and the PPM counts agree, and that the flags arrived earlier.
3. Convert the calendar PM to a condition trigger. Once the correlation holds in your own plant, on your own robots, the time-based sample stops earning its labor cost.
4. Feed grease results back into the record. Sample data integrated alongside vibration history gives you a fuller picture of each joint than either source alone.
Want to see how the two data sets compare on your equipment? Request an assessment and we'll scope a pilot on your highest-risk robots.